ORIGINAL ARTICLE
Maternal and early-life vitamin D deficiency enhances allergic reaction in an ovalbumin-sensitized BALB/c mouse model
Jiang Wu1,3†, Yan Zhong1,2†, Xiuhua Shen1,2, Kefeng Yang1,2,3* and Wei Cai1,2,3*
1Department of Clinical Nutrition, Xin Hua Hospital, Shanghai Jiao Tong University School of Medicine, Shanghai, China; 2Department of Nutrition, Shanghai Jiao Tong University School of Medicine, Shanghai, China; 3Shanghai Key Laboratory of Pediatric Gastroenterology and Nutrition, Shanghai, China, 200092
Abstract
Background: Recent studies have shown that vitamin D deficiency may contribute to the high prevalence of food allergy but the underlying mechanisms are far from clear.
Objective: The present study was designed to investigate the effect of maternal and early-life vitamin D deficiency in the development of food allergy.
Design: BALB/c mice were treated with ovalbumin (OVA) to trigger allergic reactions, under vitamin D-deficient (by maternal and early-life feeding of vitamin D deprived chow diet) or vitamin D-sufficient conditions.
Results: Increased occurrence and severity of allergic diarrhea as well as decreased rectal temperature were observed after OVA sensitization. For vitamin D deficiency groups, OVA-specific IgE and IL-4 levels were significantly increased, while IFN-γ levels were unchanged. Vitamin D deficiency also attenuated the structure of small intestinal villi and decreased the expression of the tight junction protein between adjacent epithelial cells and the percentages of CD4+CD25+Foxp3+Treg cell in spleen and mesenteric lymph nodes.
Conclusions: Maternal and early-life vitamin D deficiency have notable influence on the susceptibility to food allergy, which may relate with the reduced population of Treg cell and the dysfunction of intestinal epithelial barrier.
Keywords: vitamin D deficiency; food allergy; Treg cells; tight junctions; intestinal epithelial barrier
†These authors contributed equally to this work.
Citation: Food & Nutrition Research 2018, 62: 1401 - http://dx.doi.org/10.29219/fnr.v62.1401
Copyright: © 2018 Jiang Wu et al. This is an Open Access article distributed under the terms of the Creative Commons Attribution 4.0 International License (http://creativecommons.org/licenses/by/4.0/), allowing third parties to copy and redistribute the material in any medium or format and to remix, transform, and build upon the material for any purpose, even commercially, provided the original work is properly cited and states its license.
Received: 3 October 2017; Revised: 16 April 2018; Accepted: 17 April 2018; Published: 31 May 2018
Competing interests and funding: No potential conflict of interest was reported by the authors. The present study was supported by National Natural Science Foundation of China (No. 81270958, 30972427) and Shanghai Municipal Commission of Health and Family Planning (No. 20114114).
*Correspondence to: Kefeng Yang Department of Clinical Nutrition Xin Hua Hospital Shanghai Jiao Tong University School of Medicine 1665 Kongjiang Road Shanghai 200092, China Email: yangkf@sjtu.edu.cn
Wei Cai Department of Clinical Nutrition Xin Hua Hospital Shanghai Jiao Tong University School of Medicine 1665 Kongjiang Road Shanghai 200092, China Email: caiw204@sjtu.edu.cn
Over 1 billion people of all ages worldwide have vitamin D deficiency (1), which is largely due to the changes in lifestyle, such as extended time for indoor activities, reduced exposure to sunlight, usage of sunscreen products, and limited food sources of vitamin D (2–4). Accompanying the high prevalence of vitamin D deficiency, the incidence of food allergy also shows a gradual upward trend (5). Many epidemiological evidences indicate that vitamin D deficiency could be a potential risk factor contributing to the incidence of food allergy, such as reduced ultraviolet (UV) exposure, and vitamin D deficiency is correlated with increased incidence of food allergy in the general population (6); children born in fall and winter with less exposure of Ultraviolet Radiation B (UVB) (related to lower vitamin D levels) have higher risk of developing food allergy (7–10); the number of children visiting emergency department or being hospitalized for food allergy increased from south to north in the United States (11, 12). Prospective cohort studies demonstrate that maternal intake of vitamin D was inversely associated with allergic reactions in the offspring (13, 14). In spite of the above researches, the underlying mechanisms are still unclear.
The barrier function of intestinal mucosa is critical for the occurrence and prevention of food allergy (15–17). Our previous study identified the disruption of intestinal barrier function and increased intestinal permeability in an allergen-induced food allergy animal model (18). Vitamin D was found to be an important mediator of intestinal epithelial defenses against infectious agents and its deficiency predisposed to more severe intestinal injury in an infectious mice model of colitis (19).
Vitamin D also has wide-ranging impact on the growth and differentiation of immune cells as well as the production of cytokines (20, 21). For the immunologic mechanisms of food allergy, increasing importance has been attached to the differentiation and balance of CD4+ T cell subgroups, such as regulatory T cells (Treg, CD4+CD25+Foxp3+ cell). Treg cells are characterized by their ability to regulate immune responses through inhibiting the activation of Th2 cells and suppressing the production of IgE (22).
As such, this paper investigates the hypothesis that maternal and early-life vitamin D deficiency may trigger the cascade of food allergy reaction through its influences on the development of intestinal barrier function and immune cells.
Materials and methods
Animals and treatment
Female BALB/c mice (8-week-old, Shanghai Slac Laboratory Animal Inc) were randomly assigned to standard group and vitamin D-deficient group. The standard group was fed with standard chow diet (SC; n = 6) containing 1,000 IU vitamin D3/kg, and the vitamin D-deficient group was fed with vitamin D-deprived chow diet (VD- ; n = 6). Both chow diets contain 1.2% calcium and 0.8% phosphorus to prevent the mice from becoming hypocalcemic (23). The compositions of chow diets are listed in Table 1. Mice were housed in standard polycarbonate cages and maintained in a temperature (22 ± 2°C) and humidity (50–70%) controlled room on a 12 h light–dark cycle with access to water and chow ad libitum. All mice were housed under incandescent light which did not emit detectable ultraviolet B as detected by UV radiometer (XR-1000, Spectronics, Burbank, CA, USA). After 6 weeks, serum concentrations of 25(OH) D3 were detected to evaluate vitamin D deficiency in VD- group. The SC and the VD- groups were mated with control chow-fed male BALB/C mice. All pregnant mice were maintained on their previous chows during gestation and lactation period. Female offspring of both groups were weaned at 21 days after birth and fed on either standard chow or vitamin D-deprived chow to generate four offspring groups: standard chow-fed offspring of SC-fed dams (SC/SC; n = 10); vitamin D-deprived chow-fed offspring of SC-fed dams (SC/VD-; n = 10); standard chow-fed offspring of vitamin D-deprived chow-fed dams (VD-/SC; n = 10), and vitamin D-deprived chow-fed offspring of vitamin D-deprived chow-fed dams (VD-/VD-; n = 10). Allergic reactions of offspring were induced at the age of 6 weeks and divided into two stages: sensitization and challenge. Firstly, the offspring were sensitized with 0.2 mL suspension containing 1 mg aluminum hydroxide (reagent grade, Sigma-Aldrich, St. Louis, MO, USA) and 75 μg ovalbumin (OVA, purity ≥ 98%; Sigma-Aldrich, St. Louis, MO, USA) by intraperitoneal injection on day 0 (6 weeks of age) and day 14 (8 weeks of age). Then, the offspring were challenged by oral gavage of 50 mg OVA on day 28, 30, 32, 35, 37, and 39 (24). Ten mice in SC/SC group were treated with Phosphate Buffer Saline (PBS) as negative control (NC) group (n = 10). Twenty-four hours after the last OVA challenge, the offspring were gavaged with 50 mg OVA again and then sacrificed 1 h later for the collection of blood and tissue samples. The animal protocol for this study was approved by the Animal Care and Welfare Committee of Shanghai Jiao Tong University, School of Medicine (Approval ID: SYXK2016-0009).
Table 1. Diet compositiona
| Nutrient (g/100g) |
Standard chow diet (SC) |
Vitamin D-deprived chow diet (VD-) |
| Corn starch |
40 |
40 |
| Casein |
20 |
20 |
| Maltodextrin |
14 |
14 |
| Sucrose |
10 |
10 |
| Cellulose |
5 |
5 |
| Soybean oil |
7 |
7 |
| Mineral & vitamin mix 1b,c |
4 |
|
| Mineral & vitamin mix 2d |
|
4 |
aDiet composition was based on the recommendations of AIN-93G purified diet for laboratory rodents.
bMineral and vitamin mix 1 contains vitamin D3 (1,000 IU/kg VD3 in the chow).
cThe compositions of mineral and vitamin mix 1 and 2 are the same (except for vitamin D3), which were based on the formulae of AIN-93G-MX and AIN-93G-VX.
dMineral and vitamin mix 2 contains no vitamin D3.
Assessment of diarrhea and rectal temperature
Allergic diarrhea was assessed by monitoring mice for 60 min after the last OVA challenge and scored as follows: 0, normal-normal stools or absent; 1, slight-wet and soft stools; 2, moderate-wet and soft stools with moderate perianal staining of the coat; 3, severe-watery stool with severe perianal staining of the coat. Measurement of rectal temperature was conducted before and after the last OVA challenges by rodent thermometer (BIO-TK8851, EB Instruments, Inc, Pinellas Park, USA).
Assessment of 25-OH vitamin D3, calcium, and OVA-specific antibodies in sera
Serum was collected after centrifugation of blood samples at 3,000 g for 15 min and stored at −80°C until subsequent analysis. Immunoenzymetric assay for the quantitative measurement of 25-hydroxy vitamin D3 [25(OH)D3] in serum was performed via ELISA kit (DE1971, DEMEDITEC Diagnostics GmbH, Kiel, Germany). Serum calcium was measured using Atomic Absorption Spectrophotometer (AA-6300, Shimadzu, kyoto, Japan). Serum levels of OVA-specific IgE were detected by ELISA kit according to the manufacturer’s instructions (IgE, AKRIE-030, Shibayagi, Gunma, Japan).
Quantification of CD4+CD25+Foxp3+ by flow cytometry
The spleen and mesenteric lymph nodes (MLN) were dissociated from the mice, and single-cell suspensions of the spleen and MLN were prepared as previously described (25). 1×10⁶ splenoctyes and MLN cells in 100 μL of single-cell suspension were surface stained with fluorescein isothiocyanate (FITC)-labeled Anti-Mouse CD4 (cat.11-0042, eBioscicence, San Diego, CA, USA) and Allophycocyanin (APC) conjugated CD25 (cat.17-0251, eBioscicence, San Diego, CA, USA), then fixed and permeabilized by using Foxp3 staining buffer set and subsequently stained with phycoerythrin (PE)–labeled Anti-Mouse Foxp3 or the corresponding isotype control antibodies overnight at 4°C. Immunostained cells were analyzed with BD FACSCaliburTM Flow Cytometer (Becton Dickinson, Mountain View, CA) and the data were analyzed with CellQuest software (BD Biosciences, San Jose, CA, USA). After gating the lymphocyte population, the populations of CD4+CD25+Foxp3+ were gated and analyzed.
Detection of cytokines in cells culture of spleen and MLN after in vitro stimulation
Single-cell suspension was prepared immediately after the collection of spleen and MLN from the mice. Cells were incubated at a density of 1×10⁶ cells/mL in 24-well plates and stimulated with 1 mg/mL OVA at 37° in 5% CO2 atmosphere. Forty-eight hours later, the supernatant of the cell culture was collected to detect the concentrations of interferon-γ (IFN-γ) and interleukin-4 (IL-4) by ELISA kit (R&D Systems, Minneapolis, MN, USA) according to the manufacturer’s instructions. All procedures were performed under sterile conditions.
Western Blotting for claudin-1, zonula occludens (ZO)-1, and occludin
Frozen small intestinal segments were ground in liquid nitrogen and lysed with fresh lysis buffer (10 mmol/L HEPES pH7.9, 10 mmol/L sodium chloride, 1.5 mmol/L magnesium chloride, 1 mmol/L EGTA, 0.2 mol/L sucrose, 1 mmol/L DTT, 1 mmol/L PMSF, 1× protease inhibitor cocktail, 4× phosphatase inhibitor cocktail 1, 4× phosphatase inhibitor cocktail 2, 0.5% NP-40) on ice for 5 min. Protein extracts were then collected from the supernatants after centrifugation at 10,000 g for 15 min and Lowry assay was used to determine protein content. Samples containing 40 μg of protein were separated by SDS-PAGE and then electrotransfered to a polyvinylidene fluoride membrane (0.2 μm, Bio-Rad). The membrane was blocked by 10% milk in TBS/T (30 mM Tris base pH 7.6, 200 mM NaCl and 0.1% Tween 20) for 1 h at room temperature and then incubated with 1:1,000 rabbit polyclonal antibody against claudin-1 (ab15098, Abcam, Cambridge, MA, USA), 1:1,000 rabbit polyclonal antibody against ZO-1 (ab59720, Abcam, Cambridge, MA, USA), and 1:1,000 rabbit polyclonal antibody against occludin (ab168986, Abcam, Cambridge, MA, USA) in 10% milk at 4°C overnight. After incubation with goat anti-rabbit secondary antibody (Shanghai Kangchen Bio-tech Company), western blot image was captured by chemiluminescence detection reagent kit (Shanghai Kangchen Bio-tech Company). An anti-β-actin antibody (ab8227, Abcam, Cambridge, MA, USA) was used as an internal control.
Histological analysis
Small intestine specimens were collected 5 cm distal to the ligament of treitz and 1 cm in length. The tissues were fixed in 10% formalin and then embedded in paraffin wax blocks, which were cut into 8 μm-thick sections and subjected to hematoxylin and eosin (H&E) staining. The slides were photographed by Nikon Eclipse80i microscope (Tokyo, Japan). Histological changes were scored blindly by a pathologist and graded as follows: 1, normal histology; 2, mild villus edema/enlargement; 3, moderate villus edema/enlargement and separation of the surface epithelial cells from lamina propria; 4, epithelial cell loss or necrosis. This histopathological examination is modified by that of Ozkan (26).
Statistical analysis
Data were expressed as mean ± SD and sample sizes are indicated in the figure legends. First, data were tested for normal distribution and homogeneity of variance, and then differences among the groups were evaluated by one-way ANOVA test followed by Fisher’s least significant difference (LSD) post hoc test for vitamin D level in offspring, the occurrences of diarrhea, the diarrhea score, the changes in rectal temperature, serum OVA-specific IgE levels, the percentages of CD4+CD25+Foxp3+Treg cells, IFN-γ and IL-4 levels, histopathological grading, and the protein expressions of tight junction (TJ); For vitamin D level, body weight, gestation period, and litter size for dams, the differences between groups were analyzed by the independent samples t-test. The differences in mortality for offspring between groups were analyzed by chi-square test. Level of significance was set at P<0.05. All analyses were performed using SPSS16.0 software (IBM Corp, New York, NY, USA).
Results
Maternal and offspring observations
As Table 2 shows, body weight of dams fed with vitamin D-deficient chow diet did not alter significantly at gestation day 0.5 (the morning when the presence of vaginal plugs was observed) and at gestation day 19 (before delivery) when compared with dams fed with SC diet. Vitamin D deficiency had no effect on average litter size and gestation period either. There was no significant difference for mortality and birth weight in offspring born to SC and VD- dams. The body weight of offspring at the age of 6 weeks in each group did not differ from each either (data not shown). These results indicate that vitamin D deficiency did not exert obvious influence on gestational and birth outcomes, offspring mortality, and prematurity.
Table 2. Maternal and offspring observations
| Observations |
Standard chow diet (SC) |
Vitamin D-deprived chow diet (VD-) |
p |
| Body weight for dams at gestation day 0.5 (g) |
24. 1 ± 0.9 |
23.5 ± 1.2 |
>0.05 |
| Body weight for dams at gestation day 19 (g) |
39.4 ± 4.1 |
37.8 ± 3.3 |
>0.05 |
| Gestation period for dams (d) |
20.4 ± 0.3 |
20.6 ± 0.2 |
>0.05 |
| Litter size (n) |
8.5 ± 1.2 |
7.8 ± 0.8 |
>0.05 |
| Mortality for offspringa |
1/51 |
2/47 |
>0.05 |
| Birth weight for offspring (g) |
1.36 ± 0.10 |
1.38 ± 0.09 |
>0.05 |
Data are represented as means ± SD except mortality for offspring.
aMortality for offspring is shown as the ratio of dead offspring to total offspring.
Serum level of vitamin D in dams and offspring
After being fed on VD- chow diet for 6 weeks, serum concentration of 25(OH)D3 in the VD- group (35.80 ± 15.79 ng/mL) was significantly lower than that in the SC group (100.36 ± 14.53 ng/mL) (p<0.01) (Fig. 1a). For offspring, serum levels of 25(OH)D3 in SC/VD-, VD-/SC, and VD-/VD- groups were significantly decreased when compared with SC/SC group, and VD-/VD- group had the lowest level of 25(OH)D3 (Fig. 1b). The result indicates that vitamin D-deprived chow diet feeding significantly reduced serum concentration of 25(OH)D3 in dams. There was no significant difference in the serum calcium levels among dam groups (2.32 ± 0.16, 2.27 ± 0.13 mmol/L in SC and VD- group, respectively, p > 0.05) and offspring groups (2.05 ± 0.11, 1.98 ± 0.10, 2.07 ± 0.15, 2.03 ± 0.09 mmol/L in SC/SC, SC/VD-, VD-/SC, VD-/VD- groups, respectively, p > 0.05).
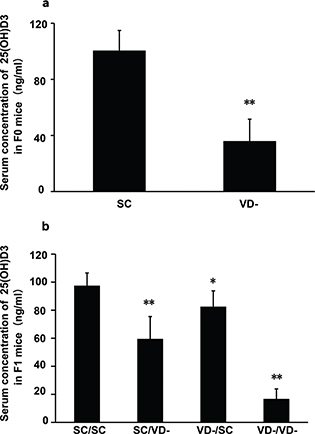
Fig. 1. Serum concentration of 25(OH)D3 in F0 and F1 mice. (a) Serum concentration of 25(OH)D3 in F0 mice (n = 6) after being fed vitamin D-deprived diet or control diet for 6 weeks. (b) Serum concentration of 25(OH)D3 in F1 mice at the end of experiment (n = 10). Data are presented as mean ± SD. *p < 0.05 when compared to SC or SC/SC groups, ** p < 0.01 when compared to SC or SC/SC groups.
OVA-induced anaphylaxis symptoms in offspring
In sensitized mice, the occurrences of diarrhea were increased compared with control group (Fig. 2a). The diarrhea score of VD-/VD- group were significantly higher than that of SC/SC group in the fourth and sixth challenge time (p<0.05) (Fig. 2b). The changes in rectal temperature in sensitized mice were lower than control group. In VD-/VD- group, the changes in rectal temperature were significantly decreased when compared with SC/SC group (p < 0.05) (Fig. 2c).
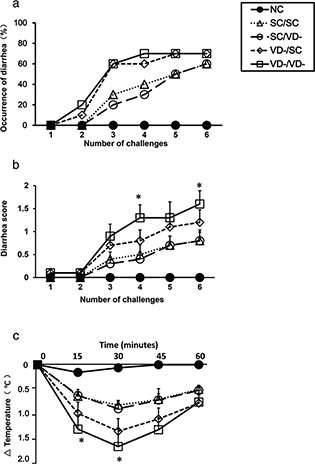
Fig. 2. OVA-induced anaphylaxis symptoms in offspring. (a) The occurrence of diarrhea. (b) The diarrhea score. (c) The changes in rectal temperature. Data are presented as mean ± SD (n = 10). * p < 0.05 when compared to SC/SC groups.
Serum levels of OVA-specific IgE in offspring groups after OVA sensitization
Serum OVA-specific IgE levels in all OVA-treated groups were significantly elevated as compared with PBS-treated NC group (p<0.01) (Fig. 3), indicating that one manifestation of allergic reactions have been successfully triggered by OVA sensitization. Serum concentrations of OVA-specific IgE were higher in VD-/SC and VD-/VD- group than in SC/SC group (p<0.01), whereas the OVA-specific IgE level of SC/VD- group did not change significantly when compared with SC/SC group. Serum level of OVA-specific IgE in VD-/VD- group was the highest among all offspring groups.
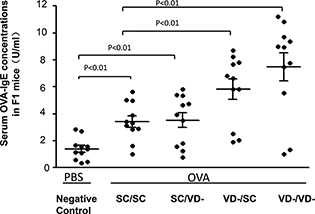
Fig. 3. Serum levels of OVA-specific IgE in offspring groups. The level of serum OVA-IgE in OVA and PBS-treated groups were determined by ELISA Kit. Data are presented as mean ± SD (n = 10).
CD4+CD25+Foxp3+Treg cells in spleen and MLN
Compared with the NC group, the percentages of CD4+CD25+Foxp3+Treg cells in the spleen of all OVA-treated groups were significantly decreased (p<0.01). For offspring challenged with OVA, the percentages of CD4+CD25+Foxp3+Treg cells in VD-/SC and VD-/VD- groups were significantly lower than that in SC/SC group (p < 0.01) (Fig. 4a). In MLN, the percentages of CD4+CD25+Foxp3+Treg cell in all OVA-treated groups were lower than NC group but only the percentage in VD-/VD- group was significantly lower than SC/SC group (p < 0.01) (Fig. 4b).
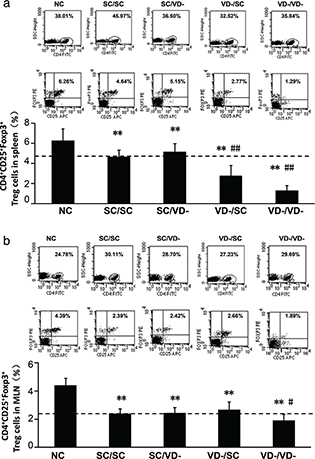
Fig. 4. Frequency of CD4+CD25+Foxp3+Treg cells. (a) Percentage of CD4+CD25+Foxp3+Treg cells in spleen. (b) Percentage of CD4+CD25+Foxp3+Treg cells in MLN. The percentages were calculated as % of total CD4+ cells. The bar values represent the mean ± SD (n = 10). **p < 0.01 when compared to NC group, #p < 0.05 when compared to SC/SC group, ##p < 0.01 when compared to SC/SC group.
Production of IFN-g and IL-4 by spleen and MLN cells
No significant differences were observed in the production of IFN-γ by spleen and MLN cells from each group (Fig. 5a and b). Compared with the NC group, the levels of IL-4 in all OVA-treated groups were significantly increased in spleen and MLN (p<0.01). IL-4 levels in VD-/SC and VD-/VD- were higher than SC/SC group (p<0.01), while production of IL-4 by spleen from VD-/VD- group was the highest among all groups (Fig. 5c and d). The rations of IFN-γ/IL-4 in all OVA-treated groups were decreased when compared with NC group. Rations in VD-/SC and VD-/VD- were significantly lower than SC/SC group (Fig. 5e and f).
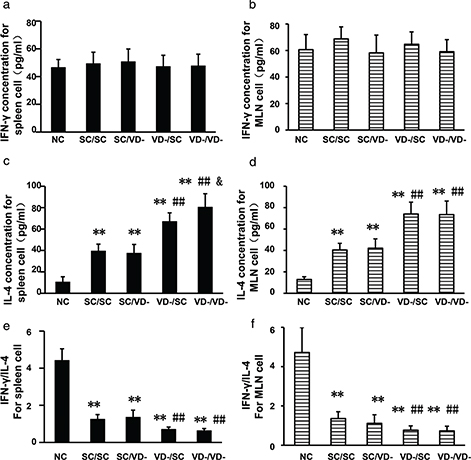
Fig. 5. Concentrations of IFN-γ and IL-4 in the culture supernatant of spleen and MLN cells after in vitro stimulation. (a) Levels of IFN-γ for spleen cell. (c) Levels of IFN-γ for MLN cell. (c) Levels of IL-4 for spleen cell. (d) Levels of IL-4 for MLN cell. (e) Ratios of IFN-γ/IL-4 for spleen cell. (f) Ratios of IFN-γ/IL-4 for MLN cell. The bar values represent the mean ± SD (n = 10). *p < 0.05 when compared to NC group, **p < 0.01 when compared to NC group, #p < 0.05 when compared to SC/SC group, ##p < 0.01 when compared to SC/SC group, &p < 0.05 when compared to VD-/SC group.
Morphology of small intestinal mucosa
The small intestinal villi of the OVA-treated groups were disrupted as shown by H&E staining, whereas the intestinal villi was intact in the NC group. SC/SC and SC/VD- group showed mild villous enlargement and edema. Marked villous enlargement and edema, separation of the epithelial cells from lamina propria were observed in VD-/SC group. The disorder of villi in VD-/VD- group demonstrated severe villous lesions including epithelial cell loss (Fig. 6a, b, c, d and e). An upward trend in the severity of mucosal lesions in these groups was indicated by histopathological grading (Fig. 6f).
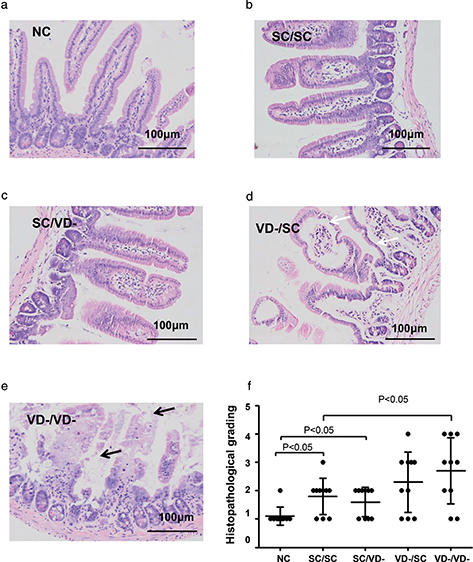
Fig. 6. Histology of small intestine. Morphology changes of small intestinal mucosa were evaluated and graded according to H&E staining. Villus edema and separation of the epithelial cells from lamina propria were indicated by black arrow. Epithelial cell loss was indicated by white arrow. (a) NC group. (b) SC/SC group. (c) SC/VD- group. (d) VD-/SC group. (e) VD-/VD- group. (f) Histopathological grading for each group.
Relative expressions of TJ proteins in small intestine
The protein expressions of TJ components, including claudin-1, ZO-1 and occludin, were detected by western blot. The protein levels of claudin-1 in all OVA-sensitized groups were significantly decreased when compared with that of NC group. The protein levels of claudin-1 in VD-/SC and VD-/VD- groups, but not SC/VD- group, were significantly lower than that of SC/SC (p < 0.01) (Fig. 7a). As compared to NC or SC/SC group, Occludin levels in SC/VD-, VD-/SC, and VD-/VD- groups were reduced significantly (p<0.01) (Fig. 7c). There is no significant difference observed for the protein expression of ZO-1 among all groups (Fig. 7b).
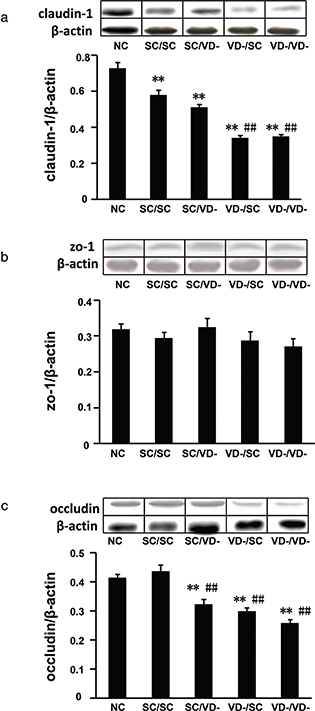
Fig. 7. Relative expressions of tight junction proteins in small intestine. (a) Protein levels of claudin-1. (b) Protein levels of ZO-1. (c) Protein levels of occludin. The bar values are means ± SD (n = 10). **p < 0.01 when compared to NC group, ##p < 0.01 when compared to SC/SC group.
Discussion
The present study shows that vitamin D deficiency during prenatal and early-life period, but not early-life period solely, promotes allergic reactions induced by OVA sensitization in BALB/c mice. The ratio of IFN-γ/IL-4 demonstrated a shift toward Th2 side in Th1/Th2 balance after OVA sensitization, which was aggravated by maternal and early-life vitamin D deficiency. The population of CD4+CD25+Foxp3+Treg cells and the protein level of TJ components (claudin-1 and occludin) were modulated by vitamin D deficiency, which could be one of the mechanisms underlying the link between vitamin D deficiency and the development of food allergy.
A number of studies on the allergen-induced BALB/c mouse model have been reported in different doses, sensitization times, and time points. OVA has been identified as the major allergen from egg white, and egg allergy is one of the most common allergies (27). In the sensitization phrase of this study, OVA and aluminum hydroxide were employed to trigger the allergic reactions of the mice. This two-stage regimen of sensitization and challenge successfully induced the allergic reaction, which was characterized by the induction of allergic parameters clinically relevant to humans, such as increased occurrence and severity of diarrhea, decreased rectal temperature, and stimulated OVA-specific IgE antibody production.
There are some human studies supporting the hypothesis that the rise in the incidence of food allergy is associated with the increased prevalence of vitamin D deficiency. Data from National Health and Nutrition Examination Survey (NHANES 2005–2006), an ongoing national research in the United States, demonstrate that children with vitamin D deficiency were more likely to have allergic sensitization to peanut and shrimp than children with normal serum level of 25(OH)D (28). Infants born in Australia with vitamin D insufficiency were more likely to be peanut and/or egg allergic than those with adequate vitamin D levels (29). However, no association was found between vitamin D level and peanut sensitization among participants aged 12–19 years from the data of NHANES (1988–1994) (30). One possible explanation for these conflicting findings may be that the starting time and the duration of vitamin D deficiency differed among these subjects. In the present study, we found that gestation and lactation is the key period when vitamin D deficiency exacerbates the allergic reaction in the offspring, which could be a critical opportunity for the prevention of food allergy.
Accumulating evidence show that vitamin D plays a pivotal role in the regulation and development of immune system. Perinatal vitamin D deficiency has been reported to have immunoregulatory effects in neonatal mice, such as Th2 skewing and decreased IL-10-secreting T regulatory cells (31). In the present study, A significantly decreased ratio of both splenic and MLNs cells was observed in vitamin D-deficient groups compared to the vitamin D-sufficient group, which suggests Th1/Th2 imbalance was involved in the link between low vitamin D status and allergic reactions in this model.
CD4+CD25+ Foxp3+ regulatory T cells play a crucial role in maintaining immunologic self-tolerance (32, 33). A growing body of researches suggests that deficiency and dysfunction of CD4+CD25+Foxp3+ regulatory T cells could be associated with the development of allergic diseases (34–36). The capacity of vitamin D to modulate Treg cell has been examined in a randomized, double-blind, and placebo-controlled trial, which showed that daily supplementation of cholecalciferol over 3 months enhanced population of Treg cells in patients with Type 1 diabetes mellitus (37). In the present study, maternal and early-life vitamin D deficiency, but not early-life alone, repressed the frequency of CD4+CD25+ Foxp3+Treg cells, showing that vitamin D might play a substantial role in the differentiation, development, maturation, and migration of CD4+CD25+Foxp3+ regulatory cells during the window period, consequently inducing the occurrence of food allergy.
The appropriate function of intestinal epithelial barrier, which is largely dependent on the intercellular TJs, is another prominent factor that may influence the development of food allergy. TJs are integral membrane proteins that form a selectively permeable seal between adjacent epithelial cells, including claudins, occludin, and ZO (38–40). The disruption of intestinal epithelial TJs leads to elevated permeability, which allows the large molecules to cross the mucosal epithelium (41). An ex vivo study reported that the expressions of TJ proteins (occludin, claudin-1 and ZO-1) were lower in small intestine biopsy specimens from food allergic patients than in those from normal subjects (42). In our study, OVA sensitization caused significantly lower protein expressions of claudin-1 and occludin, which were further decreased by maternal and early-life vitamin D deficiency. This result implies that maternal and early-life vitamin D status may influence the development of intestinal epithelial barrier through decreasing the level of TJ proteins.
Conclusion
Based on the findings of the present study, we provide insight into the relationship between vitamin D deficiency and the development of food allergy. Maternal and early-life vitamin D deficiency aggravates allergic reactions induced by OVA-treatment in BALB/c mice, thereby increasing the susceptibility to food allergy. The decreased frequency of CD4+CD25+Foxp3+Treg cells as well as the repressed expressions of TJ proteins might provide possible explanations for the association between vitamin D deficiency and the allergic reactions.
Acknowledgements
The authors thank Dr. Ouliana Ziouzenkova (Department of Human Nutrition, The Ohio State University) for advice in composing this paper.
Author’s contributions
Wei Cai, Yan Zhong, and Kefeng Yang designed the experiment. Jiang Wu and Yan Zhong conducted the animal experiments and analyzed the data; Xiuhua Shen assisted with laboratory analysis and data collection; Kefeng Yang drafted the manuscript and Wei Cai gave important advice to paper writing. All authors read and approved the final manuscript.
References
Kennel KA, Drake MT, Hurley DL. Vitamin D deficiency in adults: when to test and how to treat. Mayo Clin Proc 2010; 85(8): 752–7; quiz 757–8. doi: 10.4065/mcp.2010.0138.
Vieth R, Bischoff-Ferrari H, Boucher BJ, Dawson-Hughes B, Garland CF, Heaney RP, et al. The urgent need to recommend an intake of vitamin D that is effective. Am J Clin Nutr 2007; 85(3): 649–50.
Holick MF. Vitamin D deficiency. N Engl J Med 2007; 357(3): 266–81. doi: 10.1056/NEJMra070553.
Linos E, Keiser E, Kanzler M, Sainani KL, Lee W, Vittinghoff E, et al. Sun protective behaviors and vitamin D levels in the US population: NHANES 2003–2006. Cancer Causes Control 2012; 23(1): 133–40. doi: 10.1007/s10552-011-9862-0.
Sicherer SH, Sampson HA. Food allergy: epidemiology, pathogenesis, diagnosis, and treatment. J Allergy Clin Immunol 2014; 133(2): 291–307; quiz 308. doi: 10.1016/j.jaci.2013.11.020.
Camargo CA, Jr., Clark S, Kaplan MS, Lieberman P, Wood RA. Regional differences in EpiPen prescriptions in the United States: the potential role of vitamin D. J Allergy Clin Immunol 2007; 120(1): 131–6. doi: 10.1016/j.jaci.2007.03.049.
Green TD, LaBelle VS, Steele PH, Kim EH, Lee LA, Mankad VS, et al. Clinical characteristics of peanut-allergic children: recent changes. Pediatrics 2007; 120(6): 1304–10. doi: 10.1542/peds.2007-0350.
Sicherer SH, Furlong TJ, Munoz-Furlong A, Burks AW, Sampson HA. A voluntary registry for peanut and tree nut allergy: characteristics of the first 5149 registrants. J Allergy Clin Immunol 2001; 108(1): 128–32. doi: 10.1067/mai.2001.115755.
Vassallo MF, Banerji A, Rudders SA, Clark S, Mullins RJ, Camargo CA Jr. Season of birth and food allergy in children. Ann Allergy Asthma Immunol 2010; 104(4): 307–13. doi: 10.1016/j.anai.2010.01.019.
Matsui T, Tanaka K, Nakagawa T, Sasaki K, Nakata J, Sugiura S, et al. Sun exposure inversely related to food sensitization during infancy. Pediatr Allergy Immunol 2015; 26(7): 628–33. doi: 10.1111/pai.12445.
Rudders SA, Espinola JA, Camargo CA Jr. North-south differences in US emergency department visits for acute allergic reactions. Ann Allergy Asthma Immunol 2010; 104(5): 413–16. doi: 10.1016/j.anai.2010.01.022.
Sheehan WJ, Graham D, Ma L, Baxi S, Phipatanakul W. Higher incidence of pediatric anaphylaxis in northern areas of the United States. J Allergy Clin Immunol 2009; 124(4): 850–2 e2. doi: 10.1016/j.jaci.2009.06.044.
Nwaru BI, Ahonen S, Kaila M, Erkkola M, Haapala AM, Kronberg-Kippila C, et al. Maternal diet during pregnancy and allergic sensitization in the offspring by 5 yrs of age: a prospective cohort study. Pediatr Allergy Immunol 2010; 21(1 Pt 1): 29–37. doi: 10.1111/j.1399-3038.2009.00949.x.
Camargo CA Jr., Rifas-Shiman SL, Litonjua AA, Rich-Edwards JW, Weiss ST, Gold DR, et al. Maternal intake of vitamin D during pregnancy and risk of recurrent wheeze in children at 3 y of age. Am J Clin Nutr 2007; 85(3): 788–95.
Yu LC. Intestinal epithelial barrier dysfunction in food hypersensitivity. J Allergy (Cairo) 2012; 2012: 596081. doi: 10.1155/2012/596081.
Chen T, Liu X, Ma L, He W, Li W, Cao Y, et al. Food allergens affect the intestinal tight junction permeability in inducing intestinal food allergy in rats. Asian Pac J Allergy Immunol 2014; 32(4): 345–53. doi: 10.12932/AP0443.32.4.2014.
Jeon MK, Klaus C, Kaemmerer E, Gassler N. Intestinal barrier: molecular pathways and modifiers. World J Gastrointest Pathophysiol 2013; 4(4): 94–9. doi: 10.4291/wjgp.v4.i4.94.
Huang J, Zhong Y, Cai W, Zhang H, Tang W, Chen B. The effects of probiotics supplementation timing on an ovalbumin-sensitized rat model. FEMS Immunol Med Microbiol 2010; 60(2): 132–41. doi: 10.1111/j.1574-695X.2010.00727.x.
Assa A, Vong L, Pinnell LJ, Avitzur N, Johnson-Henry KC, Sherman PM. Vitamin D deficiency promotes epithelial barrier dysfunction and intestinal inflammation. J Infect Dis. 2014; 210(8): 1296–305. doi: 10.1093/infdis/jiu235.
Ooi JH, Chen J, Cantorna MT. Vitamin D regulation of immune function in the gut: why do T cells have vitamin D receptors? Mol Aspects Med 2012; 33(1): 77–82. doi: 10.1016/j.mam.2011.10.014.
Chun RF, Liu PT, Modlin RL, Adams JS, Hewison M. Impact of vitamin D on immune function: lessons learned from genome-wide analysis. Front Physiol 2014; 5: 151. doi: 10.3389/fphys.2014.00151.
Palomares O, Yaman G, Azkur AK, Akkoc T, Akdis M, Akdis CA. Role of Treg in immune regulation of allergic diseases. Eur J Immunol 2010; 40(5): 1232–40. doi: 10.1002/eji.200940045.
Agrawal T, Gupta GK, Agrawal DK. Vitamin D deficiency decreases the expression of VDR and prohibitin in the lungs of mice with allergic airway inflammation. Exp Mol Pathol 2012; 93(1): 74–81. doi: 10.1016/j.yexmp.2012.04.004.
Song DJ, Cho JY, Miller M, Strangman W, Zhang M, Varki A, et al. Anti-Siglec-F antibody inhibits oral egg allergen induced intestinal eosinophilic inflammation in a mouse model. Clin Immunol 2009; 131(1): 157–69. doi: 10.1016/j.clim.2008.11.009.
Zhong Y, Huang J, Tang W, Chen B, Cai W. Effects of probiotics, probiotic DNA and the CpG oligodeoxynucleotides on ovalbumin-sensitized Brown-Norway rats via TLR9/NF-kappaB pathway. FEMS Immunol Med Microbiol 2012; 66(1): 71–82. doi: 10.1111/j.1574-695X.2012.00991.x.
Ozkan KU, Ozokutan BH, Inanc F, Boran C, Kilinc M. Does maternal nicotine exposure during gestation increase the injury severity of small intestine in the newborn rats subjected to experimental necrotizing enterocolitis. J Pediatr Surg 2005; 40(3): 484–8. doi: 10.1016/j.jpedsurg.2004.11.040.
Sampson HA, Burks AW. Mechanisms of food allergy. Annu Rev Nutr 1996; 16: 161–77. doi: 10.1146/annurev.nu.16.070196.001113.
Sharief S, Jariwala S, Kumar J, Muntner P, Melamed ML. Vitamin D levels and food and environmental allergies in the United States: results from the National Health and Nutrition Examination Survey 2005–2006. J Allergy Clin Immunol 2011; 127(5): 1195–202. doi: 10.1016/j.jaci.2011.01.017.
Allen KJ, Koplin JJ, Ponsonby AL, Gurrin LC, Wake M, Vuillermin P, et al. Vitamin D insufficiency is associated with challenge-proven food allergy in infants. J Allergy Clin Immunol 2013; 131(4): 1109–16, 16 e1–6. doi: 10.1016/j.jaci.2013.01.017.
Tolppanen AM, Williams D, Henderson J, Lawlor DA. Serum 25-hydroxy-vitamin D and ionised calcium in relation to lung function and allergen skin tests. Eur J Clin Nutr 2011; 65(4): 493–500. doi: 10.1038/ejcn.2011.6.
Vasiliou JE, Lui S, Walker SA, Chohan V, Xystrakis E, Bush A, et al. Vitamin D deficiency induces Th2 skewing and eosinophilia in neonatal allergic airways disease. Allergy 2014; 69(10): 1380–9. doi: 10.1111/all.12465.
Williams LM, Rudensky AY. Maintenance of the Foxp3-dependent developmental program in mature regulatory T cells requires continued expression of Foxp3. Nat Immunol 2007; 8(3): 277–84. doi: 10.1038/ni1437.
Wan YY, Flavell RA. Regulatory T-cell functions are subverted and converted owing to attenuated Foxp3 expression. Nature 2007; 445(7129): 766–70. doi: 10.1038/nature05479.
Qamar N, Fishbein AB, Erickson KA, Cai M, Szychlinski C, Bryce PJ, et al. Naturally occurring tolerance acquisition to foods in previously allergic children is characterized by antigen specificity and associated with increased subsets of regulatory T cells. Clin Exp Allergy 2015; 45(11): 1663–72. doi: 10.1111/cea.12570.
Syed A, Garcia MA, Lyu SC, Bucayu R, Kohli A, Ishida S, et al. Peanut oral immunotherapy results in increased antigen-induced regulatory T-cell function and hypomethylation of forkhead box protein 3 (FOXP3). J Allergy Clin Immunol 2014; 133(2): 500–10. doi: 10.1016/j.jaci.2013.12.1037.
Kang SA, Park MK, Cho MK, Park SK, Jang MS, Yang BG, et al. Parasitic nematode-induced CD4+Foxp3+T cells can ameliorate allergic airway inflammation. PLoS Negl Trop Dis 2014; 8(12): e3410. doi: 10.1371/journal.pntd.0003410.
Bogdanou D, Penna-Martinez M, Filmann N, Chung TL, Moran-Auth Y, Wehrle J, et al. T lymphocyte and glycemic status after vitamin D treatment in type 1 diabetes: a randomized controlled trial with sequential cross-over. Diabetes Metab Res Rev 2017; 33(3): e2865. doi: 10.1002/dmrr.2865. PubMed PMID: 27764529.
Garrido-Urbani S, Bradfield PF, Imhof BA. Tight junction dynamics: the role of junctional adhesion molecules (JAMs). Cell Tissue Res 2014; 355(3): 701–15. doi: 10.1007/s00441-014-1820-1.
Steed E, Balda MS, Matter K. Dynamics and functions of tight junctions. Trends Cell Biol 2010; 20(3): 142–9. doi: 10.1016/j.tcb.2009.12.002.
Dejana E, Tournier-Lasserve E, Weinstein BM. The control of vascular integrity by endothelial cell junctions: molecular basis and pathological implications. Dev Cell 2009; 16(2): 209–21. doi: 10.1016/j.devcel.2009.01.004.
Catalioto RM, Maggi CA, Giuliani S. Intestinal epithelial barrier dysfunction in disease and possible therapeutical interventions. Curr Med Chem 2011; 18(3): 398–426.
Pizzuti D, Senzolo M, Buda A, Chiarelli S, Giacomelli L, Mazzon E, et al. In vitro model for IgE mediated food allergy. Scand J Gastroenterol 2011; 46(2): 177–87. doi: 10.3109/00365521.2010.525716.